New to Voyager? Please start here.
Profiling Voyager operator
Voyager operator serves runtime profiling data in the format expected by the pprof visualization tool on port :8443. The handled paths all begin with /debug/pprof/.
Follow the steps below to expose profiling data:
- Give
system:anonymoususer access to/debug/pprof/paths. This is not safe to do on a production cluster.
apiVersion: rbac.authorization.k8s.io/v1
kind: ClusterRole
metadata:
  name: appscode:system:profiler
rules:
- nonResourceURLs: ["/debug/pprof/", "/debug/pprof/*"]
  verbs: ["get", "post"]
---
apiVersion: rbac.authorization.k8s.io/v1
kind: ClusterRoleBinding
metadata:
  name: appscode:system:profiler
roleRef:
  apiGroup: rbac.authorization.k8s.io
  kind: ClusterRole
  name: appscode:system:profiler
subjects:
- apiGroup: rbac.authorization.k8s.io
  kind: User
  name: system:anonymous
$ kubectl auth reconcile -f docs/examples/monitoring/profiler.yaml
clusterrole.rbac.authorization.k8s.io "appscode:system:profiler" reconciled
clusterrolebinding.rbac.authorization.k8s.io "appscode:system:profiler" reconciled
- Now, forward the port
:8443to your workstation.
$ kubectl get pods -n voyager | grep voyager
voyager-operator-f89dcccdb-plvmt        1/1       Running   0          27m

$ kubectl port-forward -n voyager voyager-operator-f89dcccdb-plvmt 8443
Forwarding from 127.0.0.1:8443 -> 8443
Forwarding from [::1]:8443 -> 8443
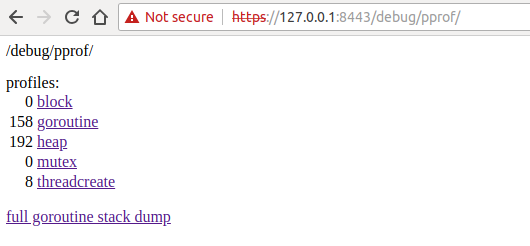
- Now, visit the url: https://127.0.0.1:8443/debug/pprof/

To look at a 30-second CPU profile:
$ go tool pprof https+insecure://localhost:8443/debug/pprof/profile
Entering interactive mode (type "help" for commands, "o" for options)
(pprof) top10
(pprof) pdf
To look at the heap profile:
$ go tool pprof https+insecure://localhost:8443/debug/pprof/heap
(pprof) top10
(pprof) pdf
- Once you are done, remove access to
system:anonymoususer.
$ kubectl delete -f docs/examples/monitoring/profiler.yaml
clusterrole.rbac.authorization.k8s.io "appscode:system:profiler" deleted
clusterrolebinding.rbac.authorization.k8s.io "appscode:system:profiler" deleted


